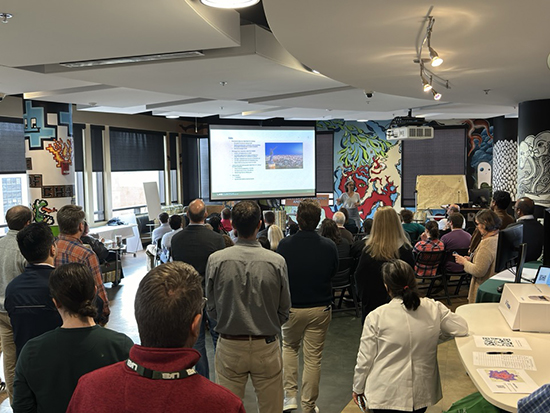
 It was standing-room only at Lister Hill Library in November as UAB faculty, students and staff presented their work with geographic information systems at the first UAB GIS Day. Part of the appeal: All Blazers now have free access to ArcGIS software through a campuswide site license.On Nov. 15, 2023, a standing-room-only audience gathered at the Center for Teaching and Learning on the fourth floor of Lister Hill Library for the university’s first GIS Day celebration. The worldwide event is designed to spread the word about the value of geographic information systems.
A geographic information system, as organizer Ariann Nassel explained, “is both a technology and a science.” The technology “is designed to work with the complexities of location-based data, connect that data to a location on a map and integrate many additional different types of data by using location as the underlying framework,” she said. “The science part of GIS includes the added benefit of having geographic context, geographic data visualization using maps, and the ability to perform spatial statistics to understand patterns and relationships in data.”
Because space and place affect a variety of topics, such as economics, health, climate, plants and animals, geography is highly interdisciplinary, said Nassel, the director of Geospatial Data Visualization at the Lister Hill Center for Health Policy: “The interdisciplinary nature of the geographical approach depends on an attentiveness to the relationship between physical and human phenomena and their spatial patterns.”
How do I access ArcGIS Pro?
If you already know what products you want to access, email Ariann Nassel at
GIS is a technology that can benefit almost everyone at UAB, Nassel says. That is because, thanks to funding from the UAB Center for Clinical and Translational Science, every UAB employee and student now has free access to the top-of-the-line ArcGIS Desktop and online web mapping software from ESRI, the world leader in GIS technology. Nassel is the head of the UAB GRID — the Geospatial Research and Information Domain — which serves as the GIS hub for the university. She organized the GIS Day event to showcase the newly available tool and allow faculty, staff and students — along with a major Birmingham-area employer — to talk about how they are using GIS in their research, in schoolwork and on the job.
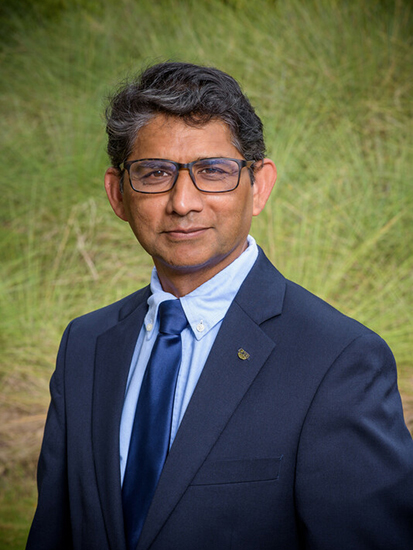 Akhlaque Haque, Ph.D. “Our relationship to data is two-dimensional,” explained Akhlaque Haque, Ph.D., professor in the Department of Political Science and Public Administration. “It is rows and columns, time series, regression models. It is who — people — interacting with what — homes, transportation links, climate data. GIS brings that third dimension. It lets you answer the question about where this is all happening.”
By tying data to locations in space, researchers can visualize spatial patterns and relationships to understand a phenomenon, Haque said: “GIS enables us to understand and interpret the patterns present in data that is linked to specific locations.”
Maps are ancient — and the amount of work involved in using them in research used to give practitioners plenty of gray hairs. Computers changed all that. Jeffery Walker, Ph.D., University Professor and J. Frank Barefield Endowed Chair of Communities and Crime, recalls that he came to GIS after becoming intrigued with a field now known as urban sociology in graduate school. Working on his doctoral dissertation in the early 1990s, Walker spent 18 months creating a mostly hand-drawn map of the ZIP codes where juvenile offenders lived in Little Rock, Arkansas. Then MapInfo, an early pioneer of GIS mapping, came out, “and you could do all that in a few hours,” Walker said.
Longtime GIS users such as Walker, Haque and Nassel are excited for the opportunity to get their colleagues interested in the power of mapping. “It is life-changing,” Walker said.
For example:
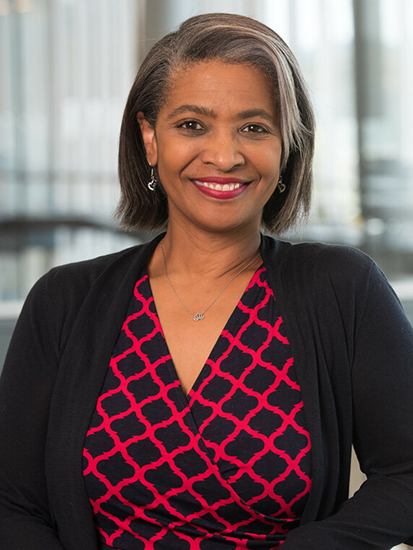 Stephanie Yates, Ph.D.Stephanie Yates, Ph.D., professor and chair of the Department of Accounting and Finance in the Collat School of Business, studies real estate. After her longtime collaborator, a geographer, retired, Yates started using ArcGIS Pro in a project with fellow Collat professor C. Allen Gorman, Ph.D. They are interested in small-dollar mortgages, or home loans of less than $100,000. These mortgages are crucial in efforts to increase home ownership rates for Black residents; but denial rates are much higher for these applicants than those of other races, and they vary widely by region. Yates has been using a vast national dataset to map home prices, mortgage applications and applicant demographics across the country by census tract.
Jamie Gajos, Ph.D., an assistant professor in the Department of Family and Community Medicine, is studying alcohol use disorder among adults experiencing homelessness in Dallas, Texas, as part of an NIH K01 grant. (Walker is one of her mentors on the grant.) She is adapting the concept of risk-terrain modeling, originally developed for use by police departments, to look at how different aspects of the built environment in an area are associated with a person’s risk for consuming alcohol. The participants in her study have agreed to use GPS-equipped smartphones and report where they are when they are about to consume alcohol. “We can layer this information about drinking locations on maps that also locate shelters, liquor stores, restaurants, food banks, hospitals and more,” Gajos said.
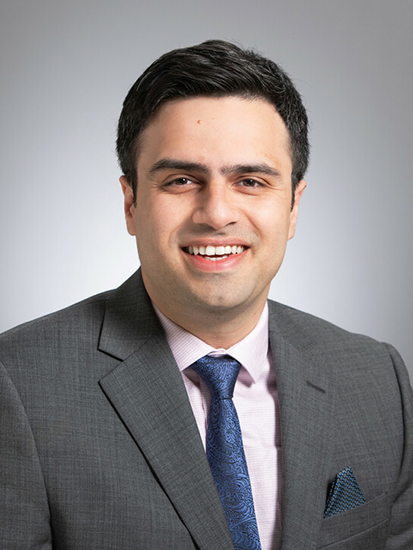 Qasim Hussaini, M.D.Senior Olivia Blanton, who took Nassel’s Introduction to GIS class (PUH 499) in fall 2023, presented her work mapping the significant links between the location of polluted areas such as brownfields and Superfund sites and the social vulnerability of the surrounding neighborhoods. This was already known, Blanton pointed out; but it is a good example “of the kind of thing you can do with GIS — inform policymakers of areas potentially needing targeted interventions, assist researchers in predicting areas where populations are likely to become victims of environmental injustice and help members of these communities inform their perception of risk.”
Qasim Hussaini, M.D., a medical oncologist and health systems researcher at the O’Neal Comprehensive Cancer Center, and assistant professor in the Division of Hematology/Oncology, explained how he is using GIS in studying how historical and contemporary housing policies interact with health outcomes nationwide. Hussaini overlays historical maps showing “redlined” neighborhoods, where banks were discouraged from making loans, with current conditions in 196 cities, including the rates of colon cancer. “If you catch colon cancer early, you can treat and cure it,” Hussaini said. But patients in former redlined neighborhoods get diagnosed at advanced stage 3 or 4 — much later than in nearby, non-redlined neighborhoods. They also have lower receipt of standard surgical or medical treatment, see more delays in chemotherapy-related treatment, and ultimately die sooner.
Nassel concluded the GIS Day proceedings with an overview of the software tools available through UAB’s ArcGIS campuswide site license. (Learn more here.) She also encouraged attendees to join the Magic City GIS Users Group for networking, asking technical GIS and data questions, job searching, GIS advice, information about software and data updates, and GIS event notifications. Any UAB employee or student can join; email Andrew King at